
This section describes methods that could be used for detecting and quantifying biological contaminants of emerging concern (BioCEC) in various environmental matrices (e.g., air, water, and soil) and vectors (Figure 1, see also Conceptual Exposure Model subsection 1.3 Defining the Environment). Reliable detection of a pathogen in environmental matrices and vectors requires a high degree of confidence in its identity and quantitation. Specific matrix subtypes are listed in Table 1. In addition to environmental matrices and their subtypes, Table 1 includes selected references and resources detailing sampling methods for each matrix. Different environmental matrices require specific sampling techniques to ensure representativeness and data quality and to avoid bias or error. Environmental sampling typically involves the development of a sampling plan (e.g., how, when, and where samples will be collected and how many), physical collection of samples, transport and storage prior to analysis, and then analysis.
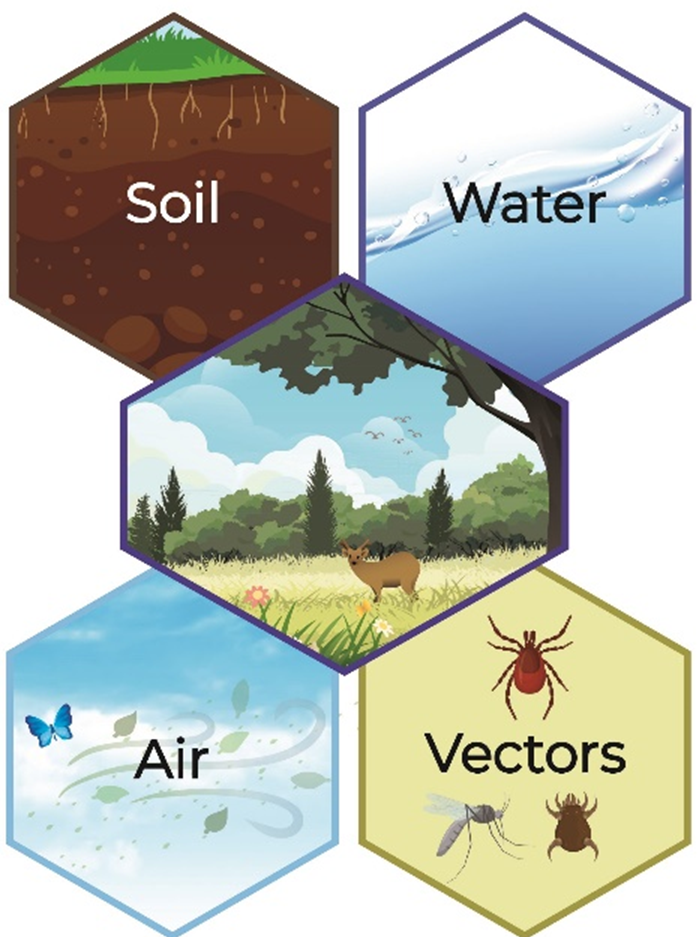
Figure 1. Graphical depiction of environmental matrices.
Designing and choosing an appropriate sampling method is complex and depends on many factors including study objectives, environmental matrix type, BioCEC characteristics, analytical method used, and available resources, to name a few. Thus, specific and comprehensive sampling methods and design plans for BioCEC are challenging to prescribe. Numerous resources cited here are publicly available and are continuously being updated and improved in recognition of the important step of sampling in BioCEC identification (see USEPA ORD 2024 [6LB8D98M] USEPA ORD. 2024. “Sample Collection.” Data and Tools. https://www.epa.gov/esam/sample-collection. , Table 1; USEPA OW 2025 [PYUKNXLB] USEPA OW. 2025. “National Aquatic Resource Surveys.” Collections and Lists. https://www.epa.gov/national-aquatic-resource-surveys. ; Zhang 2007 [QCC2HV9P] Zhang, Chunlong. 2007. Fundamentals of Environmental Sampling and Analysis. Wiley-Interscience. https://doi.org/10.1002/0470120681. ). Designing and selecting an appropriate sampling method is critical prior to applying any analytical method used for BioCEC detection. This will most likely require engagement among decision-makers, public health officials, laboratory personnel, subject matter experts, and other relevant stakeholders to ensure analytical recovery, accuracy, and reliability.
Table 1. Sampling guidance and resources by environmental matrices type and subtype
Microbiological detection and quantification methods are typically developed and tested across many laboratories and groups with well-defined method limitations and appropriate quality control practices (see Interstate Technology and Regulatory Council (ITRC) Environmental Molecular Diagnostics (EMD) Section 10 for quality control considerations). These standardized microbial methods usually represent the best technique currently available for the detection and/or quantification of a specific known pathogen (i.e., targeted analysis, which can identify organisms at genera, species, and/or even strain level classifications). To some degree, these standardized methods can be used or modified in some way to capture new groups or subtypes of known pathogens (i.e., suspect screening).
For a BioCEC, reliable and standardized analytical methods may not be readily available, especially for new pathogens that have not been encountered previously (i.e., non-target analysis). Figure 2 depicts the transition of analytical methods from targeted screening approaches that are designed to detect a particular organism, to less-specific suspect screening that can help identify the general identity of a new BioCEC based on evidence-developed hypotheses, to non-targeted screenings that can help identify BioCECs that do not fit a known description. These analytical methods and their applications are discussed in detail below in Description of Analytical Methods. Table 2 identifies whether the various methods described in Description of Analytical Methods can be used for targeted analysis, suspect screening, and non-targeted analysis, and provides examples for how these methods have been used. Table 2 provides a partial list of possible analytical methods and serves as a summary of those methods, which have been highlighted within this document.
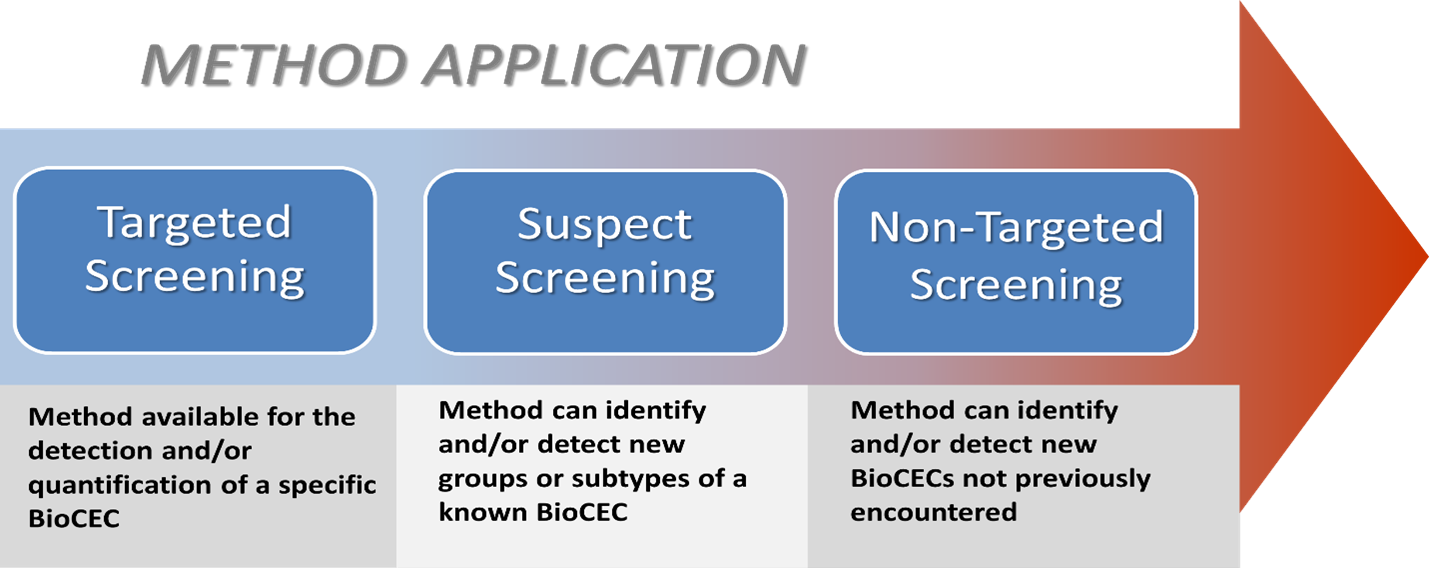
Figure 2. Flowchart of the transition from targeted screening to non-target screening of biological contaminants of emerging concern.
Table 2. Overview of analytical methods and their applications for the detection of biological contaminants of emerging concern
1 Targeted usage: The best technique currently available for the detection and/or quantification of a specific pathogen. “Yes” indicates that the method is appropriate, or applicable, for targeted usage.
2 Suspect screening: Standardized methods that can be used or modified in some way to capture new groups or subtypes of known pathogens. “Yes” or “No” indicates whether the method is appropriate, or applicable, for suspect screening.
3 Non-targeted usage: Application of a method to identify new pathogens that have not been encountered previously. “Yes,” “No,” or “Maybe” indicates whether the method is appropriate, or applicable, for non-targeted usage.
This section does not discuss the increasing use of data analytics (e.g., machine-learning approaches) for monitoring and forecasting contamination in the environment. For example, Mahmood et al. 2024 [GSW4SAFP] Mahmood, Mahnoor, Eric Minwei Liu, Amy L. Shergold, et al. 2024. “Mitochondrial DNA Mutations Drive Aerobic Glycolysis to Enhance Checkpoint Blockade Response in Melanoma.” Nature Cancer 5 (4): 659–72. https://doi.org/10.1038/s43018-023-00721-w. address the known data gaps (i.e., missing data) in groundwater quality databases by using two advanced data imputation algorithms. Results suggested that these machine learning–based algorithms can help identify sampling locations, provide geospatial information about contaminants, and prioritize analytes for testing to maximize sampling efforts and efficiently use available, but often limited, sampling resources. Nevertheless, prior to the application of more advanced data analytics, there is a need for reliable detection and quantification of BioCEC through direct analytical methods, which is the focus of this section.
1. Description of Analytical Methods
A previous ITRC effort generated detailed descriptions of EMDs, which is a collective term for advanced and emerging techniques for the analysis of biological and chemical characteristics of environmental samples (ITRC 2013). That ITRC EMD webtool and resource provides definitions of various terms also used in this section; they can be accessed by clicking on the word under the ITRC EMD Glossary tab. That ITRC resource also contains a detailed appendix of microbiology FAQs providing additional background information if needed (ITRC EMD Appendix D). The methods described below can be used for detection and/or quantification of BioCEC in the environmental matrices and subtypes listed in Table 1. As discussed in this section, selection of an analytical method will depend on numerous factors such as environmental matrix sample type; collection method used; BioCEC characteristics; potential recovery from and concentration in the original sample; and targeted analytical method accuracy, precision, and reliability. Thus, the potential challenges, advantages, disadvantages, and limitations of an analytical method are multifactorial and should be considered throughout the process of designing a sampling and collection plan and choosing an appropriate analytical method.
2. Microscopy
Microscopy is a general term used to describe the use of microscopes to view objects at a resolution that cannot be observed with the unaided eye. This method allows for the analysis of shape, size, and other characteristics that allow for the identification and classification of biological samples.
2.1 Direct or Light Microscopy
In this method, light is transmitted from a source (e.g., lamp) through a condenser, either below or above the sample. The light then passes through the sample to a magnifying lens (or objective), then to the oculars, where the enlarged sample image can be viewed.
2.2 Fluorescent Microscopy
This method relies on the underlying process of fluorescence, which occurs when a substance absorbs light of specific wavelengths and emits light at longer wavelengths. Thus, samples are the source of the visible light, in contrast to light microscopy. Most commonly, samples are stained with fluorescently labeled antibodies, nucleic acids, or fluorescent dyes, such as 4′,6-diamido-2-phenylindole, propidium iodide, and SYBR green. Samples that autofluorescence can also be detected. In fluorescent microscopy, samples are illuminated with a single or multiple wavelengths of light (excitation wavelength), and the emitted fluorescence (emission wavelengths) reaches the eye or detector ( WHO 2005 [DQ3463SM] WHO. 2005. Fluorescence Microscopy for Disease Diagnosis and Environmental Monitoring. https://applications.emro.who.int/dsaf/dsa281.pdf. ).
2.3 Electron Microscopy
This method uses a beam of electrons as the source of illumination to magnify an object, allowing for the visualization of biological structures and composition. Types of electron microscopy include scanning electron microscopy and transmission electron microscopy.
3. Culture-Based Methods
Microorganisms can be cultured in either selective or non-selective media under various conditions (e.g., temperatures, atmospheric conditions, incubation times, etc.). The combination of media type and incubation conditions can be used to select for growth of specific microbial groups, subgroups, or species ( Lagier et al. 2015 [YAJ7NZ8Y] Lagier, Jean-Christophe, Sophie Edouard, Isabelle Pagnier, Oleg Mediannikov, Michel Drancourt, and Didier Raoult. 2015. “Current and Past Strategies for Bacterial Culture in Clinical Microbiology.” Clinical Microbiology Reviews 28 (1): 208–36. https://doi.org/10.1128/CMR.00110-14. Bonnet et al. 2020 [DY8TQG8H] Bonnet, M., J. C. Lagier, D. Raoult, and S. Khelaifia. 2020. “Bacterial Culture through Selective and Non-Selective Conditions: The Evolution of Culture Media in Clinical Microbiology.” New Microbes and New Infections 34 (March): 100622. https://doi.org/10.1016/j.nmni.2019.100622. ). Growth of organisms under these specific conditions may be considered “presumptive,” meaning that both the organisms of interest and off-target organisms can grow. In these cases, further testing (using other methods) may be necessary to confirm the identity of the organism. Further sample processing may be required (e.g., filtration, heat, and/or acid treatment) to culture targeted microorganisms. Cell culture systems have also been used to detect, identify, and propagate pathogens (e.g., animal models, embryonated eggs, mammalian cell lines, amoebae) ( Vouga and Greub 2016 [UL4EE9BG] Vouga, M., and G. Greub. 2016. “Emerging Bacterial Pathogens: The Past and Beyond.” Clinical Microbiology and Infection 22 (1): 12–21. https://doi.org/10.1016/j.cmi.2015.10.010. ).
4. Flow Cytometry
Flow cytometry (FC) is a method that analyzes individual cells or particles in suspension using a flow cytometer (see recent review by Robinson et al. 2023 [GGP7ZVSE] Robinson, J. Paul, Raluca Ostafe, Sharath Narayana Iyengar, Bartek Rajwa, and Rainer Fischer. 2023. “Flow Cytometry: The Next Revolution.” Cells 12 (14): 1875. https://doi.org/10.3390/cells12141875. ). The flow rate and tubing that draw samples into the cytometer are optimized to allow for a single cell to be analyzed at a time. Analyzers within the flow cytometer use multiple lasers with a variety of wavelengths and angles to investigate an individual cell. From this, the cytometer will collect data on the scatter of visible light by the cell; certain wavelengths can excite fluorescent particles associated with the cell, and the emission from this can be collected by fluorescent detectors. The patterns of the visible light scatter and excitation/emission spectrums of the fluorescence signal can provide important information about the characteristics of the cells or particles (e.g., relative size, internal complexity, surface properties, identity, etc.). To maximize the discriminatory power of this method, samples can also be labeled with fluorescently tagged molecules targeting specific suspects (i.e., fluorescently labeled antibodies) that will allow for specific identification of the biological contaminants.
Method detection limits for FC include size and concentration of the biological agent. If the particles are too small, as is the case with the average virion, the cytometer will likely not be able to detect it. If the agent is too large (i.e., some parasites, or clumps of cells that were not dispersed properly), the detector will not properly categorize the particle. Similarly, the concentration of a target in a sample may also be a limiting factor for detection. If only a few representatives are present in a sample, it may be that any positives could be dismissed as erroneous detections.
A flow cytometer can be equipped with a cell sorter, which will allow for the collection and concentration of cells that meet an investigator’s criterion. This can then allow for further investigations using the concentrated sample.
5. Matrix-Assisted Laser Desorption Ionization Time-of-Flight (MALDI-TOF) Mass Spectrometry (MS)
MALDI-TOF MS is a method that can rapidly identify pathogens or biological molecules by generating a spectral profile that is then compared against a library of reference spectral profiles of known biologicals ( Ashfaq et al. 2022 [8CJQXV8G] Ashfaq, Mohammad Y., Dana A. Da’na, and Mohammad A. Al-Ghouti. 2022. “Application of MALDI-TOF MS for Identification of Environmental Bacteria: A Review.” Journal of Environmental Management 305 (March): 114359. https://doi.org/10.1016/j.jenvman.2021.114359. ). Profiles are generated by ionizing biological particles (e.g., cellular proteins such as ribosomes), which move through a flight tube driven by an electric field separating the particles according to their mass and charge. The time-of-flight is measured by instrument detectors at the end of the flight tube. The x-axis of the spectra indicates the mass-to-charge values, and the y-axis shows the intensity of the signal.
6. Polymerase Chain Reaction (PCR)
PCR is a method used to amplify specific, targeted DNA sequences. The technique uses a pair of short synthetic DNA segments called primers that recognizes the start (5′) and end (3′) of the targeted DNA sequence. These primers help guide the enzyme, DNA polymerase, to copy the target DNA sequence through repeated cycles of heating and cooling. This enables the DNA strands to separate and for primers to anneal and then be extended by DNA polymerase to exponentially generate detectable copies of the target DNA sequence ( NIH: National Human Genome Research Institute 2025 [2CMPPAC2] NIH: National Human Genome Research Institute. 2025. “Polymerase Chain Reaction (PCR).” https://www.genome.gov/genetics-glossary/Polymerase-Chain-Reaction-PCR. ).
6.1 Quantitative Polymerase Chain Reaction (qPCR)
This is a very sensitive technique used to amplify short gene sequences (e.g., 80–150 base pairs). It provides real-time monitoring of the exponential amplification process via fluorescence probes or dyes. The detected fluorescence is proportional to the amount of DNA in the reactions, facilitating precise quantification of DNA by interpolation from standard curves. Primers are designed via primer-BLAST (https://www.ncbi.nlm.nih.gov/tools/primer-blast/index.cgi?GROUP_TARGET=on) or can be derived from published methods or other peer-reviewed literature.
6.2 Digital Polymerase Chain Reaction (dPCR)
This is an advanced nucleic acid quantification method that has no need for standard curves to determine quantities of target DNA. Digital polymerase chain reaction involves partitioning a sample into thousands of small volume reactions, each containing zero or at least one DNA molecule. The number of positive partitions is counted to absolutely determine the exact number of target molecules by using the Poisson mass probability distribution.
6.3 High Throughput Polymerase Chain Reaction
High throughput PCR enables the simultaneous amplification and detection of multiple target DNA sequences using a single integrated microfluidic circuit or similar platform ( Franklin et al. 2021 [8GNQ66YM] Franklin, A. M., N. E. Brinkman, M. A. Jahne, and S. P. Keely. 2021. “Twenty-First Century Molecular Methods for Analyzing Antimicrobial Resistance in Surface Waters to Support One Health Assessments.” Journal of Microbiological Methods 184 (May): 106174. https://doi.org/10.1016/j.mimet.2021.106174. ).
6.4 Multiplex Polymerase Chain Reaction
This enables simultaneous detection of multiple DNA targets in a single PCR using distinct primers (ITRC 2013; Ramírez et al. 2015 [6MIIBHWJ] Ramírez, Juan Carlos, Carolina Inés Cura, Otacilio da Cruz Moreira, et al. 2015. “Analytical Validation of Quantitative Real-Time PCR Methods for Quantification of Trypanosoma cruzi DNA in Blood Samples from Chagas Disease Patients.” The Journal of Molecular Diagnostics 17 (5): 605–15. https://doi.org/10.1016/j.jmoldx.2015.04.010. ). It provides more information when working with scarce samples.
7. Genomics
Genomics is a field of biology focused on studying all the DNA of an organism (i.e., its genome). Sequencing technologies have evolved over the last few decades ( Rolando et al. 2024 [9XQI444Y] Rolando, Justin C., Arek V. Melkonian, and David R. Walt. 2024. “The Present and Future Landscapes of Molecular Diagnostics.” Annual Review of Analytical Chemistry 17 (Volume 17, 2024): 459–74. https://doi.org/10.1146/annurev-anchem-061622-015112. ). The first widely used method was developed by Walter Gilbert and Allan Maxam and involved radiolabeled adenosine triphosphate–modified DNA resolved by gel electrophoresis. Frederick Sanger developed first-generation sequencing that used dideoxynucleotides for chain-termination and DNA sequences by gel electrophoresis. Newer sequencing technologies are frequently referred to as next-generation sequencing (NGS). These NGS technologies enable parallel analysis of clinical and environmental samples and are classified into short- and long-read sequencers. The short-read sequencers include Illumina sequencing-by-synthesis via reversible terminator chemistry, Thermo Fisher Scientific Ion Torrent semiconductor chips, and Roche 454 pyrosequencing (no longer available but mentioned here for historical purposes). The long-read sequencing technologies include PacBio single-molecule real-time and Oxford nanopore electrical current density sequencing.
These NGS technologies are used for genomics, metagenomics, and metatranscriptomics of microbes in environmental samples. Microbial genomics entails bioinformatic assembly of short and/or long reads to generate complete pathogen genomes in pure cultures, which aids their identification ( Knight et al. 2018 [R8IH4A22] Knight, Rob, Alison Vrbanac, Bryn C. Taylor, et al. 2018. “Best Practices for Analysing Microbiomes.” Nature Reviews Microbiology 16 (7): 410–22. https://doi.org/10.1038/s41579-018-0029-9. ). Metagenomics involves sequencing the entire microbiome in an environmental sample, which yields detailed genomic and taxonomic information for pathogens. Metatranscriptome analysis uses RNA sequences to profile active genes (e.g., virulence and antimicrobial resistance genes) to help evaluate microbial activity and discriminate live from dormant or dead pathogens. NGS technologies generate vast amounts of sequence data, necessitating the curation of databases organized for querying and retrieval of information, and phylogenetic and phylogenomic analysis ( Vidanagamachchi and Waidyarathna 2024 [7BB38CA6] Vidanagamachchi, S. M., and K. M. G. T. R. Waidyarathna. 2024. “Opportunities, Challenges and Future Perspectives of Using Bioinformatics and Artificial Intelligence Techniques on Tropical Disease Identification Using Omics Data.” Frontiers in Digital Health 6 (November): 1471200. https://doi.org/10.3389/fdgth.2024.1471200. ).
8. Fluorescence In Situ Hybridization (FISH)
FISH is a method used to visualize and enumerate specific types of microorganisms or groups of microorganisms in an environmental sample (ITRC EMD). FISH can provide information regarding the abundance of microorganisms or genes of interest in a sample, cell morphology and growth characteristics, spatial distributions and associations with other microorganisms, and microbial community structure. The FISH method involves (1) the fixation and permeabilization of microorganisms to make their cellular membranes permeable to fluorescently labeled oligonucleotide probes, (2) hybridization of these probes to nucleic acid targets in the microorganisms, (3) washing to remove excess probe, and (4) visualization and enumeration via microscopy or another method, such as FC (Flow Cytometry) for high-speed counting.
9. Microbial Fingerprinting Methods
9.1 Phospholipid Fatty Acid (PLFA)
This method analyzes the key component of microbial cellular membranes and involves several steps, including (1) lipid extraction from the sample, (2) column separation/fractionation, (3) phospholipid modifications, (4) separated and modified components detected by a flame ionization detector, and (5) the generation of a chromatogram profile. PLFA fingerprinting methods provide a measure of total viable biomass and a broad-based profile of the microbial community composition and is best suited for assessing microbial responses as a result of a treatment (e.g., decontamination) or natural or anthropogenic induced environmental changes (ITRC 2013; Quideau et al. 2016 [B8EI5MGG] Quideau, Sylvie A., Anne C. S. McIntosh, Charlotte E. Norris, Emily Lloret, Mathew J. B. Swallow, and Kirsten Hannam. 2016. “Extraction and Analysis of Microbial Phospholipid Fatty Acids in Soils.” Journal of Visualized Experiments (JoVE), no. 114 (August): e54360. https://doi.org/10.3791/54360. Lewe et al. 2021 [34NNPP5C] Lewe, Natascha, Syrie Hermans, Gavin Lear, et al. 2021. “Phospholipid Fatty Acid (PLFA) Analysis as a Tool to Estimate Absolute Abundances from Compositional 16S rRNA Bacterial Metabarcoding Data.” Journal of Microbiological Methods 188 (September): 106271. https://doi.org/10.1016/j.mimet.2021.106271. ).
9.2 Denaturing Gradient Gel Electrophoresis (DGGE)
DGGE is a non-quantitative technique that provides a DNA-based profile of the microbial community and allows identification of the predominant organisms, generally to the family or genus level. This is achieved by separating PCR-amplified fragments of a targeted gene (e.g., 16S rRNA gene) to allow visualization of patterns of distinguishable bands representing different microorganisms within a sample. DGGE analysis cannot, however, quantify specific organisms or microbial functions present within a sample. This method can also be used to identify and compare the presence/absence of specific organisms among samples. (ITRC 2013).
9.3 Pulsed Field Gel Electrophoresis (PFGE)
PFGE is a non-quantitative analysis that allows for the production of a DNA-based profile on genetic material up to 10 megabase pairs in length. This contrasts with traditional gel electrophoresis, which only reliably resolves up to 20 kilobase pairs ( Sharma-Kuinkel et al. 2016 [JJQNX9FX] Sharma-Kuinkel, Batu K., Thomas H. Rude, and Vance G. Fowler. 2016. “Pulse Field Gel Electrophoresis.” In The Genetic Manipulation of Staphylococci: Methods and Protocols, edited by Jeffrey L. Bose. Springer. https://doi.org/10.1007/7651_2014_191. ). By using only specific restriction enzymes to cut the genomic material, specific lengths of genomic material will be generated based on the host. These can then be separated using a specialized electrophoresis device that has pairs of electrodes placed at different angles. By changing the angle of the electric field during the run, it effectively gives more distance to resolve the DNA fragments, allowing for the observance of larger bands of DNA. This is ideal for suspect screening methods involving well-characterized suspects, as the DNA band profile that is developed needs to be compared to existing profiles for identification. Additionally, its ability to resolve large genomes lends the technique credence in the identification of bacteria or eukaryotic contaminants.
9.4 Multilocus Sequence Typing (MLST)
MLST is a non-quantitative analysis that uses DNA sequencing to determine the identity of an unknown. PCR (Polymerase Chain Reaction (PCR)) is performed with primers directed at variable regions within several key genes. These PCR products are then sequenced and compared to existing databases of genomes (or subsets specifically curated for MLST) to determine the identity of the unknown ( Larsen et al. 2012 [9U8D5WLG] Larsen, Mette V., Salvatore Cosentino, Simon Rasmussen, et al. 2012. “Multilocus Sequence Typing of Total-Genome-Sequenced Bacteria.” Journal of Clinical Microbiology 50 (4): 1355–61. https://doi.org/10.1128/jcm.06094-11. ). Originally, this was performed using seven key genes, but as the technique has been expanded to include a wider variety of organisms, the exact set of genes to analyze has some variability. This technique has applications for targeted analyses and suspect screening. Although it can be used for non-targeted analysis, it may be more productive to perform whole genome sequencing of an unknown contaminant.
9.5 Restriction Fragment Length Polymorphism (RFLP)
RFLP is a non-quantitative analysis that relies on restriction enzymes’ ability to cut at specific sites ( Hashim and Al-Shuhaib 2019 [JJ94PM72] Hashim, Hayder O., and Mohammed Baqur S. Al-Shuhaib. 2019. “Exploring the Potential and Limitations of PCR-RFLP and PCR-SSCP for SNP Detection: A Review.” Journal of Applied Biotechnology Reports 6 (4): 137–44. https://doi.org/10.29252/JABR.06.04.02. ). This method is based on the differences in DNA sequences between BioCEC (e.g., between different strains or subtypes of the same microbial species). For example, DNA sequences for a certain gene may be different between similar BioCEC, but the gene product performs the same function between the similar BioCEC. In this case, these nucleotide differences, or polymorphisms, can be detected when they change where restriction enzymes cut. This is often used in tandem with PCR amplification of particular genes to reduce the background noise of genetic material in a sample. The PCR fragments are then subjected to restriction enzyme cuts, and the size of the resulting fragments is resolved through a technique such as gel electrophoresis. This helps inform the fingerprint of a given sample. This is best used in suspect screening or targeted analysis, as the produced fingerprint needs to be compared to existing fingerprints for identification.
9.6 Terminal Restriction Fragment Length Polymorphism (T-RFLP)
T-RFLP is a modification of RFLP that uses PCR primers with fluorescent probes. Rather than analyzing the entirety of the fragments produced by a restriction enzyme cutting a PCR product, only the fluorescently labeled ends of the PCR product (the terminal ends) are analyzed for their change in size ( De Vrieze et al. 2018 [KINBEPP4] De Vrieze, Jo, Umer Z. Ijaz, Aaron M. Saunders, and Susanne Theuerl. 2018. “Terminal Restriction Fragment Length Polymorphism Is an ‘Old School’ Reliable Technique for Swift Microbial Community Screening in Anaerobic Digestion.” Scientific Reports 8 (1): 16818. https://doi.org/10.1038/s41598-018-34921-7. ). It effectively reduces the amount of analysis needed to determine differences in the fingerprint, while potentially missing polymorphisms occurring in the middle of the PCR product. The same limitations that apply to RFLP apply here as well.
10. Isothermal Amplification Approaches
Isothermal amplification techniques use constant temperature and DNA strand–displacing enzymes that facilitate the extension of gene-specific primers on double-stranded DNA. Exponential amplification of the target sequence is due to isothermal cyclic repetition of these processes and, unlike PCR, does not require thermal denaturation for the primers to bind to template DNA. There are several kinds of isothermal amplification systems, and three are listed below:
- Recombinase polymerase amplification ( Piepenburg et al. 2006 [UVSEXV95] Piepenburg, Olaf, Colin H. Williams, Derek L. Stemple, and Niall A. Armes. 2006. “DNA Detection Using Recombination Proteins.” PLOS Biology 4 (7): e204. https://doi.org/10.1371/journal.pbio.0040204. ) uses recombinase protein to mediate the invasion of primers into the double-stranded DNA and uses single-stranded binding proteins to stabilize the complex for elongation by an isothermal polymerase such as Phi-29.
- Helicase-dependent amplification ( Vincent et al. 2004 [4Y4TDBSY] Vincent, Myriam, Yan Xu, and Huimin Kong. 2004. “Helicase‐dependent Isothermal DNA Amplification.” EMBO Reports 5 (8): 795–800. https://doi.org/10.1038/sj.embor.7400200. ) uses a DNA helicase to enzymatically unwind double-stranded DNA to generate single-stranded complementary strand templates for primer extension by DNA polymerase.
- Loop-mediated isothermal amplification ( Notomi et al. 2000 [CGILLTXK] Notomi, Tsugunori, Hiroto Okayama, Harumi Masubuchi, et al. 2000. “Loop-Mediated Isothermal Amplification of DNA.” Nucleic Acids Research 28 (12): e63. https://doi.org/10.1093/nar/28.12.e63. ) involves inner and outer primers that generate a self-priming dumbbell structure with two stem loops that, after multiple rounds of amplification, generate large self-amplifying concatemers (which is a term for a long, continuous DNA molecule that contains multiple copies of the same DNA sequence linked in series).
The advantages of these isothermal amplification approaches are simplicity (constant temperature eliminates the need for thermal cyclers), speed (rapid detection in 30 minutes), and suitability to be deployed in the field (e.g., lateral flow assays). The disadvantage of these approaches is a higher limit of detection relative to PCR.